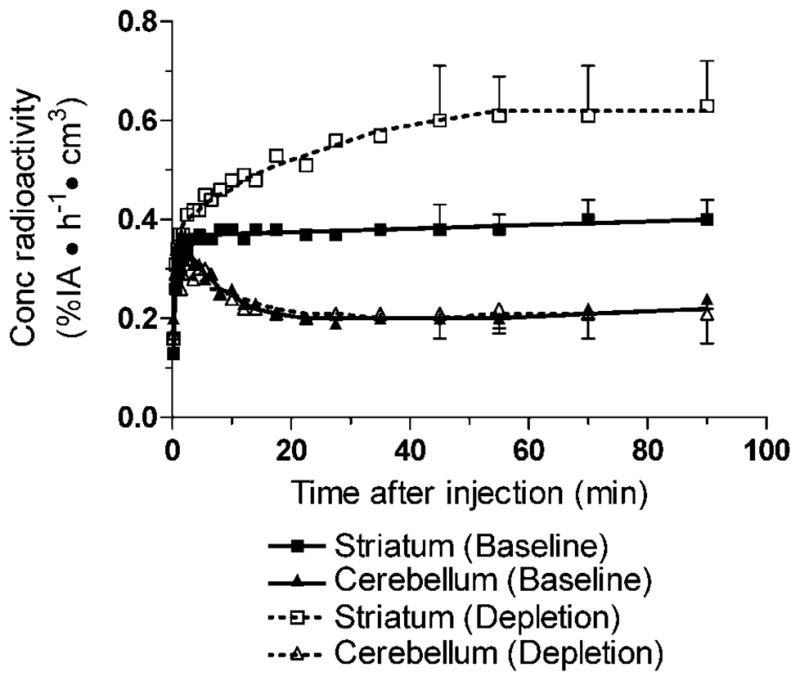
Fig. 1.

Time–activity curves of [11C]MNPA at baseline (solid lines) and after dopamine depletion (dashed lines). Symbols are the mean of five scans each at baseline and after dopamine depletion. Bars for standard deviation are shown for time frames used for calculating the equilibrium reference tissue model (i.e., 45–90 min). The concentration of radioactivity is expressed as % injected activity (IA) per hour per cm3 brain. Symbols: (■) striatum baseline; (□) striatum depletion; (▲) cerebellum baseline; (△) cerebellum depletion. The triangle symbols (open and filled) indicate cerebellum overlap at several time points.
