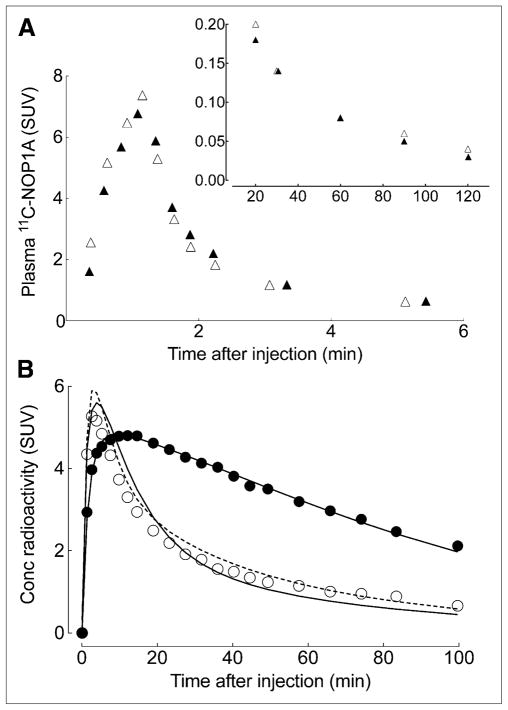
FIGURE 2.
Representative time–activity curves of 11C-NOP-1A in plasma and brain at baseline and after receptor blockade with SB-612111 in single monkey. (A) 11C-NOP-1A concentration, separated from radiometabolites, in arterial plasma is plotted at baseline (▴) and after receptor blockade (Δ). Values from 0 to 6 min and from 20 to 100 min are plotted on separate graphs, which differ in range of y-axis. (B) Concentrations of radioactivity in occipital cortex after injection of 11C-NOP-1A are shown at baseline (●) and after receptor blockade (○). Measured brain data were fit with 1-tissue (solid line) and 2-tissue (dotted line)-compartment models. At baseline conditions, 2 fittings overlap almost completely.

