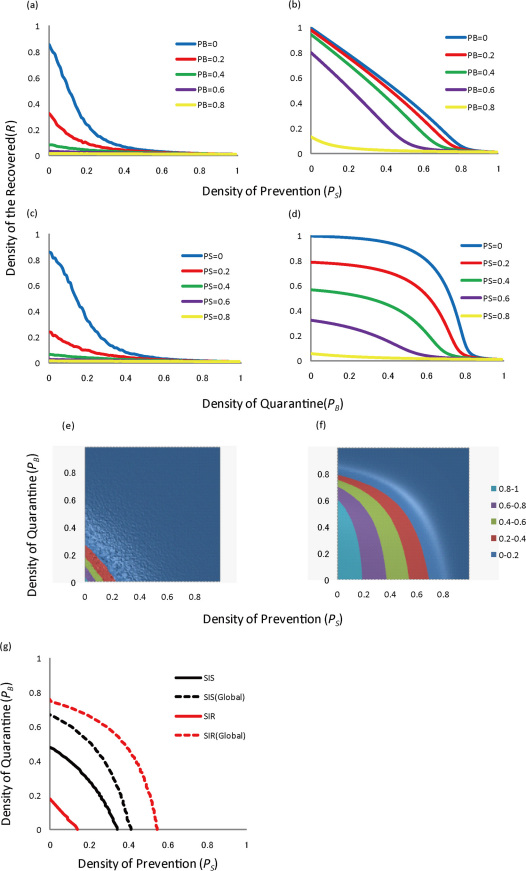
Figure 2. The final density of the recovered sites (R) for the combined model of both prevention (site percolation) and quarantine (bond percolation) with a constant infection rate (β/γ = 5.0).
(a) local interaction (simulation) and (b) global interaction (mean-field theory analyses) against the density of prevention PS, where PB = 0 (blue), 0.2 (red), 0.4 (green), 0.6 (purple) and 0.8 (yellow). (c) local interaction (simulation) and (d) global interaction (mean-field theory analyses) against the density of quarantine PB, where PS = 0 (blue), 0.2 (red), 0.4 (green), 0.6 (purple) and 0.8 (yellow). Phase diagrams along with the densities of both prevention (PS) and quarantine (PB) for (e) local interaction by simulation and (f) global interaction by mean-field theory (densities of the recovered (R) are shown in colors: blue = 0–0.2; red = 0.2–0.4; green = 0.4–0.6; purple = 0.6–0.8; pail blue = 0.8–1.0). (g) comparisons with the steady state density of SIS models for a half (50%) reduction in infection level for both global and local interactions (Black solid line: SIS for local; black dashed line: SIS for global; red solid line: SIR for local; and red dashed line: SIR for global). The combined effect is the largest for the local SIR model; a half (50%) reduction is achieved merely by PS = PB = 0.1 or less.

