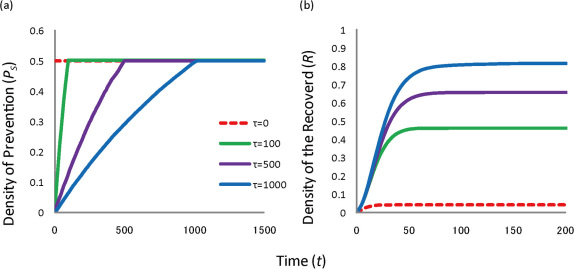
Figure 3. Dynamics of the recovered (R) when the density of prevention PS increases in the SIR model.
(a) The temporal profiles of prevention introduction. (b) The temporal dynamics of the recovered density (R). The final proportion of prevention (site blocked) is set at PS = 0.5 and the rate τ is defined as the time to reach at PS = 0.5. Four different delayed times τ of protection are used for comparisons: (1) no delay in prevention corresponding to Fig. 1a (τ = 0; red dashed line), (2) a fast rate (τ = 100; green line), (2) a moderate rate (τ = 500; purple line), and (3) a fast rate (τ = 1000; blue line).

