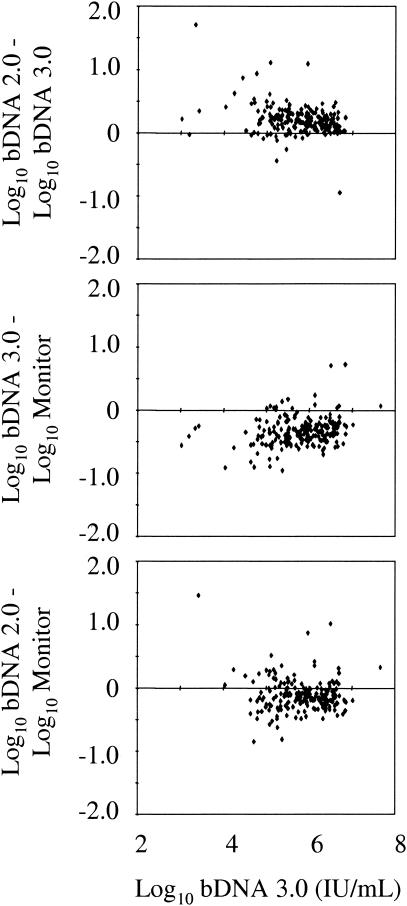
FIG. 3.
Differences between assay results from consecutive clinical specimens. Log10-transformed bDNA 3.0 HCV RNA values are shown on the x axis. Differences between the log10-transformed HCV RNA values obtained from the same clinical specimens by the bDNA 2.0, bDNA 3.0, and COBAS Monitor assays are indicated on the y axis.

