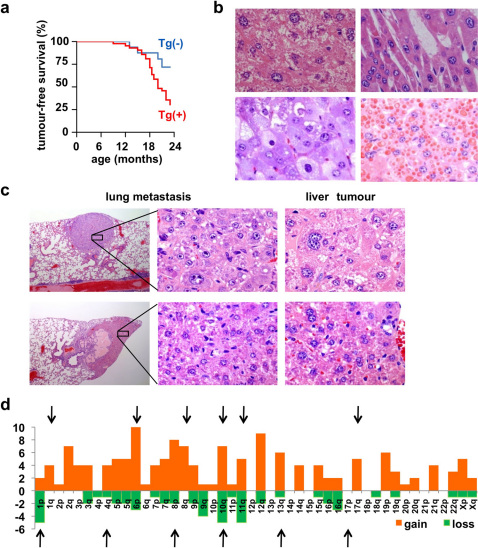
Figure 4. Hepatocellular carcinoma (HCC) in FEAT transgenic mice.
(a) Kaplan-Meier curve for tumour-free survival of FEAT transgenic mice (Tg (+)) (red) (n = 40) and nontransgenic littermates (Tg (-)) (blue) (n = 17) (P = 0.038, log-rank test). (b) Various histological subtypes of HCC. Well-differentiated tumours composed of dysplastic hepatocytes with atypical large polyploid nuclei and anisokaryosis with compact (upper left panel) and trabecular (upper right panel) growth patterns, and variants such as a clear-cell type (left lower panel) and HCCs with cytoplasmic inclusion bodies (right lower panel). (c) Morphology of neoplastic cells in lung metastases, which were similar to primary liver tumours. (b and c) hematoxylin and eosin (H&E) staining. Original magnifications are: ×115 (c, left panels) and ×600 (b; c, middle and right panels). (d) Syntenic human chromosomal regions corresponding to CNAs detected by array comparative genomic hybridization (array-CGH). Each column shows the number of genes present in each human chromosomal arm that was commonly gained (red) or lost (green) in HCCs of FEAT transgenic mice (n = 6). The arrows indicate the chromosomal arms that are gained or lost in human HCCs 41.

