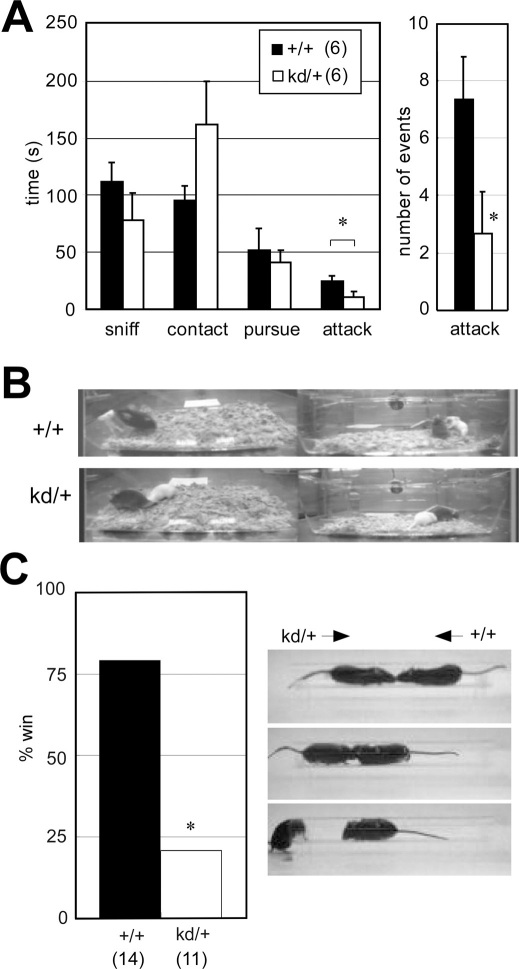
Figure 3. Social behavior abnormalities in Zic2kd/+ mice.
(A) Resident-intruder test. (left) Total time spent in the indicated behaviors. (right) The number of attacking events. *P < 0.05 in t-test. Data is presented as means ± SEM. (B) Captured video image of the resident-intruder test. In this case, the Zic2+/+ mouse (+/+, top, black) was attacking the white intruder mouse, whereas the Zic2kd/+ mouse (kd/+, bottom black) was moving away from the intruder mouse. The left and right images indicate the simultaneous recording from opposite directions. (C) Social dominance tube test. (left) Won rate in the total of 66 matches. The means ± SEM latencies to win were as follows: Zic2+/+, 36.5 ± 5.2; Zic2kd/+, 38.3 ± 6.4 s. (right) Captured video images from a representative match. From top to bottom, the beginning to the end of the match is sequentially indicated. In this case, the Zic2kd/+ mouse was pushed out from the plexiglass tube (30 cm) and the Zic2+/+ mouse became the winner. *P < 0.05 in chi-square test. The number of mice in each group is given in parentheses.

