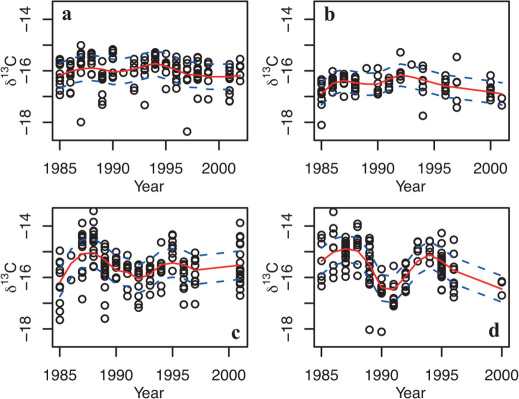
Figure 3. Temporal trends in δ13C values (‰) in salmon scale collagen.
(a) River Frome 1SW, (b) River Frome MSW, (c) North East Coast 1SW, (d) North East Coast ΜSW. Temporal scale represents the last year of marine feeding. Solid (red) line is a first-order LOESS fit with a span width of 0.5; dashed (blue) lines show +/− standard error of the residuals of the smoothed fit.

