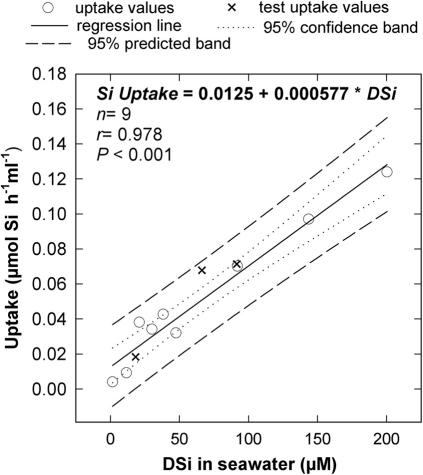
Figure 1. Relationship between DSi uptake and DSi availability during initiation of experiment I.
The uptake-rate response by the sponges (µmol Si per h and ml of sponge) was linearly related to DSi concentration in the experimental bottles, whenever DSi availability ranged from natural values (1.6 µM) to 200 µM. Crosses are 3 further treatment steps (20, 70 and 100 µM DSi) conducted as a test after allowing sponges to rest for 5 days at natural DSi concentration. Note that all 3 test responses fell within the 95% prediction interval of the previously calculated regression equation.

