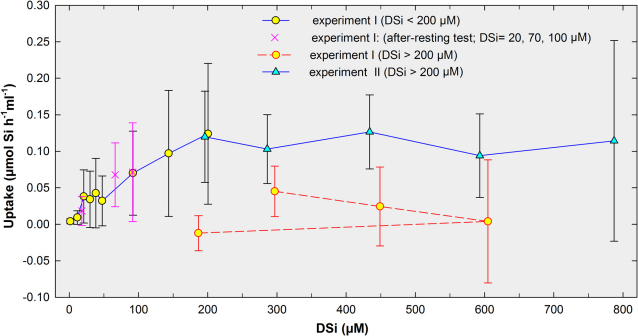
Figure 2. Summary of sponge uptake responses during experiments I and II.
The solid line indicates the course of average uptake rates (µmol Si per h and ml of sponge ± s.d.) by "healthy" (i.e., non-fluorine poisoned) sponge sets in response to experimental DSi concentrations during the first phase of the hexafluorosilicate-based experiment I (yellow circles) and through the metasilicate-based experiment II (blue triangles). Crosses are 3 treatment steps (20, 70 and 100 µM DSi) conducted as a test after allowing sponges to rest for 5 days at natural DSi concentration prior to initiating the second phase of experiment I. The dashed line indicates average (± s.d.) uptake rates during the second phase of experiment I (i.e., DSi >200 µM), in which sponges became poisoned by high concentrations of fluorine released from sodium hexafluorosilicate.

