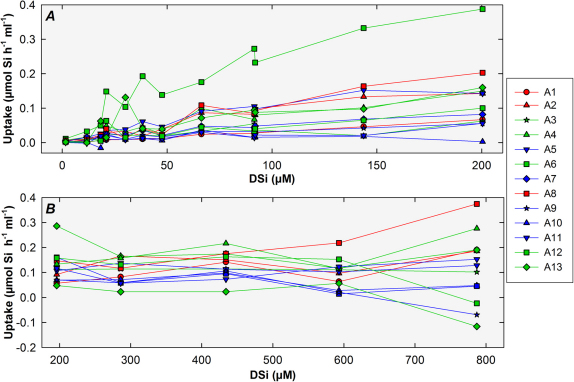
Figure 3. Summary of individual uptake data.
Some variability was noticed in the individual uptake responses during the "healthy" phase of experiment I (a) and through experiment II (b). Green and blue lines indicate small (< 9ml) and large (> 9 ml) individuals of Axinella damicornis, respectively. Red lines indicate individuals of Axinella verrucosa or Axinella polypoides. Note that the sponge individuals used for experiments plotted in "a" and "b" graphs are different.

