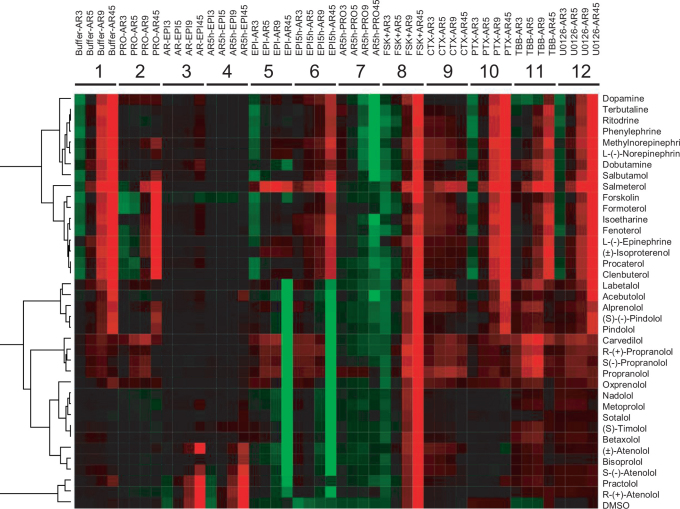
Figure 2. DMR heat map of clinically available β-drugs.
This heat map was obtained using DMR profiling of the drugs under twelve conditions, followed by similarity analysis using the Ward hierarchical clustering algorithm and Euclidean distance metrics. The twelve DMR used for analysis were: a drug-induced DMR in the cells pretreated with the assay vehicle for 1 hr (Buffer – AR), 1 μM propranolol for 1 hr (PRO – AR), 5 nM EPI for 1 hr (EPI – AR), 5 nM EPI for 5 hrs (EPI5h – AR), 400 ng/ml CTx for overnight (CTx – AR), 100 ng/ml PTx for overnight (PTx – AR), 10 μM TBB for 1 hr (TBB – AR), and 10 μM U0126 for 1 hr (U-126 – AR). In addition, we also included an EPI-induced DMR in the cells pretreated with 10 μM β-drugs for 1 hr (AR – EPI) and for 5 hrs (AR5h – EPI); an PRO-induced DMR in the cells pretreated with 10 μM β-drugs for 5 hrs (AR5h – PRO); and a forskolin (FSK)-induced DMR in the presence of β-drugs (FSK + AR).

