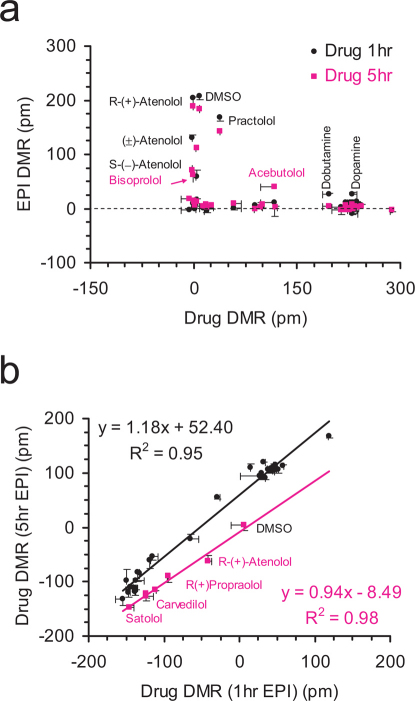
Figure 4. Correlation analysis identifies the origin of similarity among distinct β-drugs based on potency, mechanisms of activation and deactivation.
(a) Scatter plots between the β-drug-induced DMR in native cells and the EPI-induced DMR after pretreated with drugs for 1hr (black dots) or 5hr (pink dots); and (b) scatter plots between the β-drug-induced DMR in cells after pretreatment with EPI for 1hr and 5hr.

