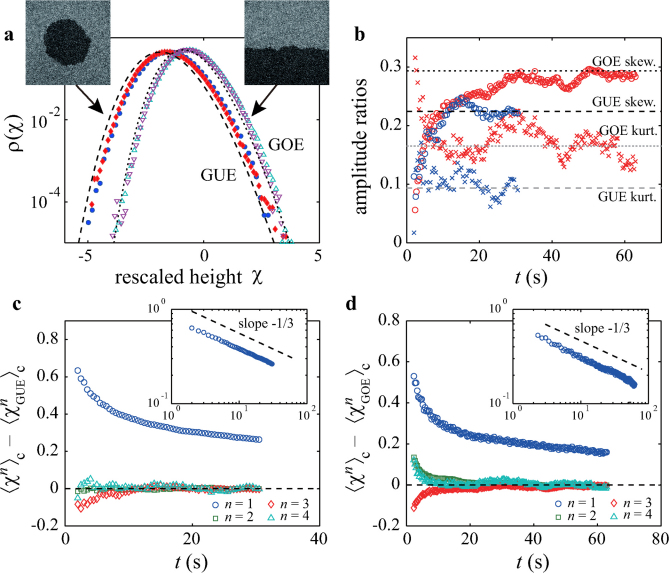
Figure 3. Universal fluctuations.
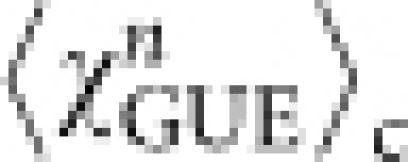
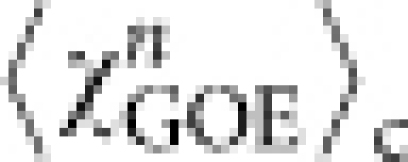
a, Histogram of the rescaled local height χ ≡ (h − v∞t)/(Γt)1/3. The blue and red solid symbols show the histograms for the circular interfaces at t = 10 s and 30 s; the light blue and purple open symbols are for the flat interfaces at t = 20 s and 60 s, respectively. The dashed and dotted curves show the GUE and GOE TW distributions, respectively. Note that for the GOE TW distribution χ is multiplied by 2−2/3 in view of the theoretical prediction31. b, The skewness (circle) and the kurtosis (cross) of the distribution of the interface fluctuations for the circular (blue) and flat (red) interfaces. The dashed and dotted lines indicate the values of the skewness and the kurtosis of the GUE and GOE TW distributions31. c, d, Differences in the cumulants between the experimental data 〈χn〉c and the corresponding TW distributions  for the ciruclar interfaces (c) and
  for the flat interfaces (d). The insets show the same data for n = 1 in logarithmic scales. The dashed lines are guides for the eyes with the slope −1/3.

