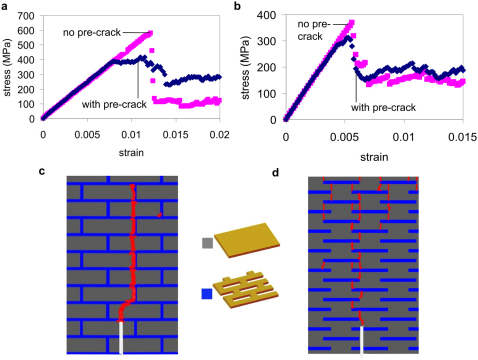
Figure 2. Characteristic stress-strain curves with and without a crack for two geometries and associated crack propagation paths (initial crack: white line, crack path: red line).
a, Bone-like composite structures, with and without presence of a pre-crack (pre-crack length 5.4 μm). The fracture strength changes drastically upon the introduction of a crack. b, Stress-strain curves for a biocalcite-like composite structure, with and without presence of a pre-crack (pre-crack length 6.96 μm). The sensitivity to fracture strength is much smaller than for the bone-like composite, although the magnitude of the fracture strength is lower. c and d, Crack pathways (marked in red) for bone-like and biocalcite-like hierarchical structures in the presence of a pre-crack. c, The image shows that for bone-like structures, the pre-crack propagates through the sample, but the structure is toughened by the platelets bridging the wake of the crack as it propagates. d, For small crack sizes failure in the biocalcite-like structure propagates through the nucleation of several micro-cracks at nanoporous silica/bulk-silica interfaces located far from the original crack tip. The fracture strength is reached when several of these micro-cracks link up along with the pre-crack to create a complete failure path through the sample. These results show that different crack propagation paths in the two structures lead to different defect-tolerance responses.

