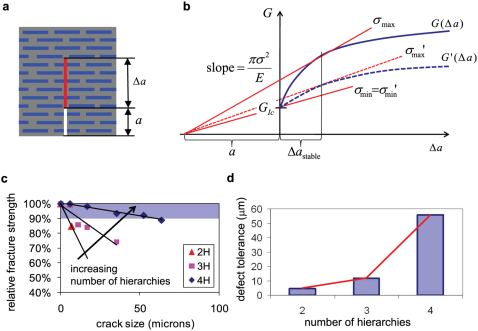
Figure 6. Relation between the R-curve, rate of fracture strength change with crack size, and the defect-tolerance length scale for varied number of hierarchies.
a, Definition of variables a (initial crack length) and Δa (crack advance length). b, Schematic of R-curve G(Δa) in a material with a rising R-curve resistance and link to unstable crack propagation. The rising R-curve shown here resembles those seen in hierarchical structures (e.g.: Fig. 5a). The load at which a crack with a certain size will propagate unstably and thus cause catastrophic failure can be calculated by marking off the crack size on the negative-X axis and constructing the tangent to the R-curve passing through this point. The slope of this curve is proportional to the load or fracture stress at which this crack propagates unstably. For comparison the plot also shows a second R-curve (G'(Δa)) that does not rise as rapidly, resembling those R-curves seen in Fig. 5a for fewer levels of hierarchies. The fracture stress at which the crack propagates unstably is much smaller, indicating a smaller defect tolerance. b, Fracture stress as a percentage loss from the strength of structures with no cracks, measured for two-, three- , and four-hierarchy structures and for varied crack sizes. The shaded region shows the crack sizes with less than 10% loss in strength. The data shows that the sensitivity of the fracture strength to crack size decreases substantially with increasing hierarchy level. c, Plot of the defect-tolerant length scale over the number of hierarchies. The defect-tolerant length-scale reaches ≈60 μm with four levels of hierarchy. The red line represents an exponential fit of L = 1.17 exp(1.255N), where L is the defect-tolerant length scale in micrometers, and N is the number of hierarchy levels. The limiting value of one level of hierarchy, i.e., bulk silica, features a vanishing defect-tolerant response on the order of nanometers.

