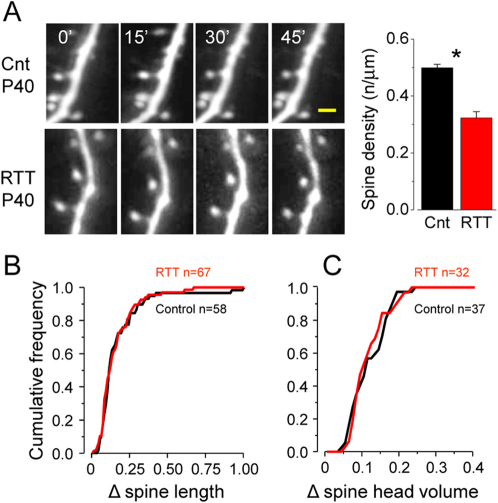
Figure 3. No differences in spine dynamics in older mice (>P40).
(A left) Time lapse imaging in a control and a RTT mouse at P40. Scale bar 2.5 μm. A right) Spine density is significantly reduced at P40 between control and RTT mice (cnt, N = 5, KO, N = 4; t-test, p<0.001) (B) Cumulative distributions of spine length fluctuations revealed no differences between control and RTT at P40 (KS, p = 0.733). (C) Cumulative distributions of spine head volume fluctuations showed no differences between control and RTT at P40 (KS, p = 0.676).

