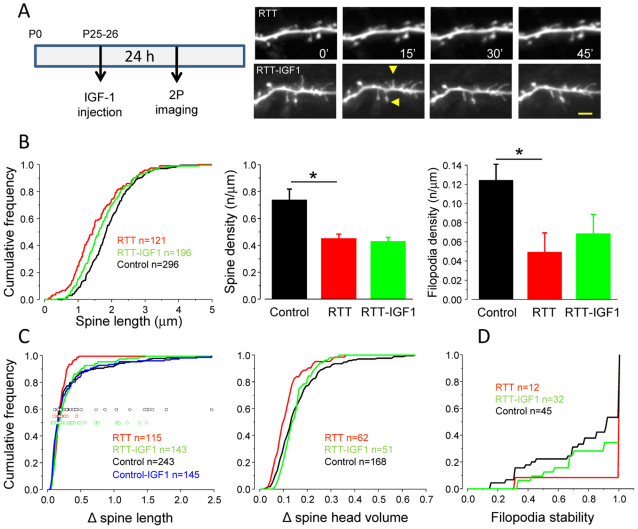
Figure 4. IGF-1 treatment restores spine dynamics in RTT mice.
(A left) Protocol of the experiment. Right) Time lapse imaging in a RTT mouse and in a RTT mouse treated with IGF-1. Scale bar 2 μm. B left) Cumulative distribution of spine length showed that the treatment with IGF-1 lead to a partial recovery of the spine length in RTT mice (data replotted from fig. 1 for control and RTT mice for comparison; KS-test, cnt vs RTT-IGF-1, p = 0.004; RTT vs RTT-IGF-1, p = 0.031). B center and right) Both spine density and filopodia densities were not affected by IGF-1 (One-Way ANOVA, post-hoc Tukey test, p<0.05). C left) Data showing the distributions of the fluctuation of spine length in the specified conditions. In the RTT mice dendritic spines are more stable than controls (replotted from fig. 2), while spine motility becomes similar to controls after IGF-1 treatment (cnt vs RTT-IGF-1, KS test,p = 0.170; RTT vs RTT-IGF-1, p = 0.010). The dots represent the average motility of each filopodia. IGF-1 treatment per se does not cause any effect in control mice (cnt vs cnt IGF-1, p = 0.16); C,center) Distribution of the fluctuations of the spine head volume in the specified conditions. The data show that after IGF-1 administration RTT spine head fluctuations become normal (KS-test: cnt vs RTT-IGF1, p = 0.50; RTT vs RTT-IGF1, p = 0.006). (D) Cumulative distribution showing that while filopodia in RTT mice are very stable in comparison to filopodia in controls, 24h after IGF-1 treatment they become less stable, with parameters intermediate between untreated RTTs and controls (KS-test; cnt vs RTT, p = 0.029; cnt vs RTT-IGF1, p = 0.469; RTT vs RTT-IGF1, p = 0.528).

