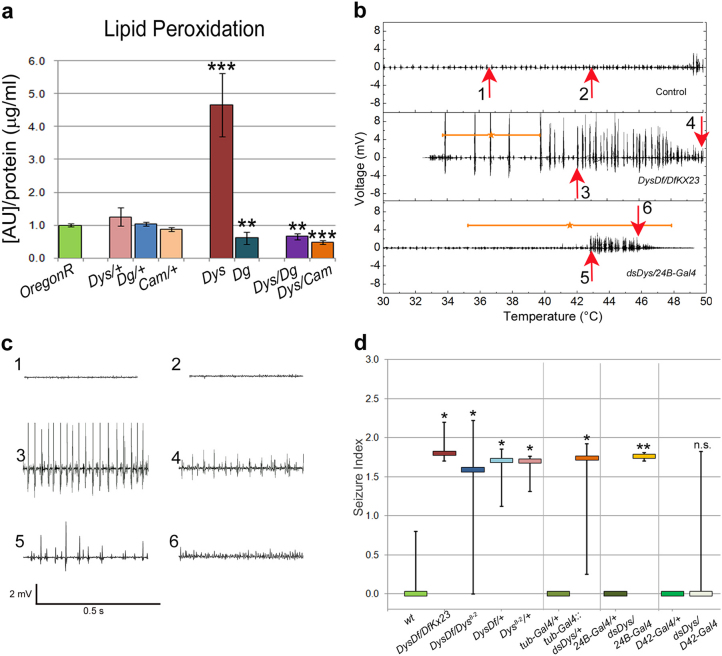
Figure 1. Dystrophin mutants have elevated ROS and hyperthermic seizures.
(a) Assessment of cellular lipid peroxidation products normalized to protein content in animals housed at 29°C for three days. The axis represents the raw molar absorption after blank subtraction and normalization to protein content. Statistical analysis was done using a one-tailed Student's t-test and the error bars represent the standard deviation. All comparisons are made against OregonR. Exact experimental values and P-values are given in Supplementary Table 1. (b) Electrical output from IFM vs. temperature during seizures of DysDf/DfKX23 and dsDys/24B-Gal4 mutants compared to Control. Stars indicate the average start temperature where the error bar indicates the standard deviation. Arrows indicate where plots in panel c are taken from. (c) Electrical output relative to time where the region examined correlates with the numbered arrows in panel b. Output is displayed over a 0.5 s time period emphasizing the increase in frequency and decrease in amplitude as the seizure progresses. (d) All tested Dys classical and RNAi alleles (levels of Dys mRNA downregulation are shown in Supplementary Table 2) had hyperthermic seizures with similar seizure indices tested in a two-tailed Kruskal-Wallis test where P = 0.316 excluding data from dsDys/D42-Gal4 animals (Supplementary Figure 1, Table 1). Seizure indices of dystrophic mutants are significantly higher when compared to the appropriate control (separated by vertical lines). One to one comparative statistics were done using a one-tailed Mann-Whitney U-test. Error bars indicate the 25th and 75th percentiles of the data spread considering that if an animal does not seize then the index is 0. The Si range of some controls have zero values in the 25th and 75th percentile range, thus it appears that there is no error bar.*P ≤ 0.05, **P ≤ 0.01, ***P ≤ 0.001.

