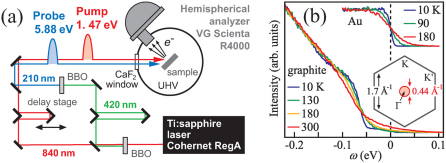
Figure 1. TrPES system.
(a) A schematic of the TrPES system. (b) Spectra of graphite recorded in normal-emission geometry. The increase of the intensity at EF with increasing T is due to the increased population of the COPs.5 Inset of (b) shows the surface Brillouin zone of graphite, and the area probed in the normal-emission geometry is indicated by a circle.

