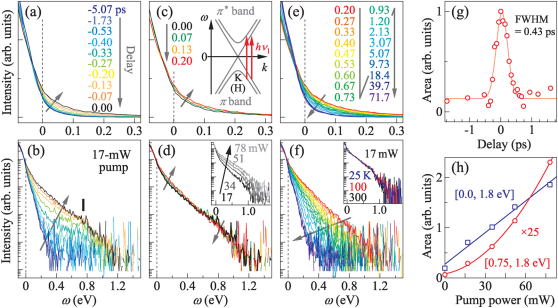
Figure 2. TrPES of graphite.
Spectra recorded at 17-mW pump at t ≤ 0 ps (a, b), 0 ≤ t ≤ 0.2 ps (c, d), and t ≥ 0.2 ps (e, f). Here, (b, d, f) are semi-logarithmic plots of (a, b, c), respectively. Insets in (d) and (f) show spectra at t = 0 ps recorded at various pump powers and temperatures, respectively. (g) Spectral weight between 0.8 – 1.0 eV as a function of t overlaid with a Gaussian. (h) Spectral weight under 0.75 – 1.8 eV (above the cutoff; circle) and under 0.0 – 1.8 eV (in the unoccupied side; square) at t = 0 ps as a function of pump power overlaid with first and second order polynomial functions, respectively. The schematic in (c) shows direct excitations from the π bands to the π* bands.

