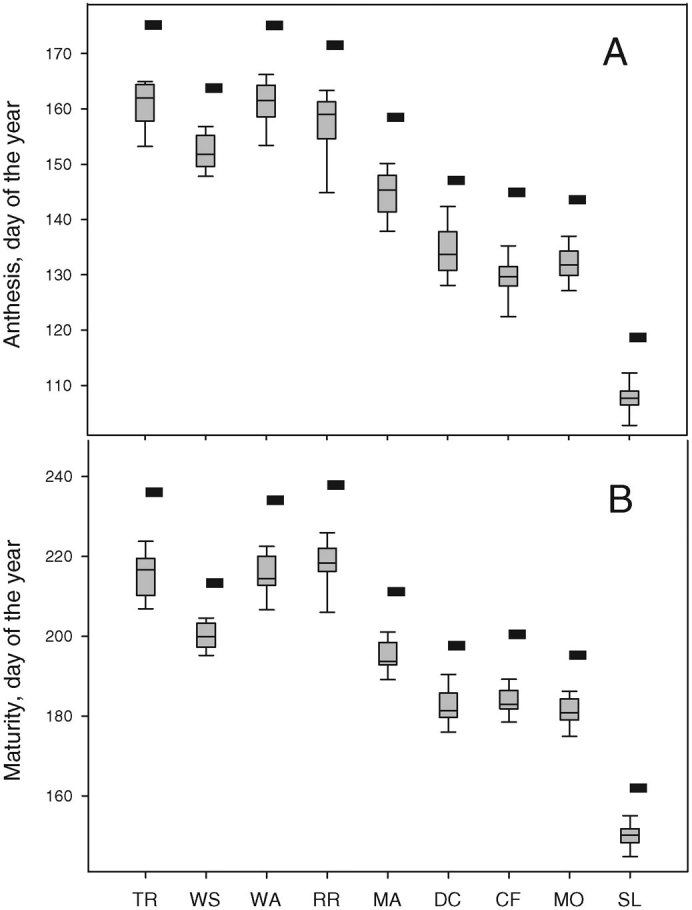
Figure 1. (A) Anthesis, and (B) maturity.

Mean simulated day of anthesis and maturity for the baseline (black rectangles) and for the 2055(A1B) scenario (box plots) at nine European sites: TR (Tylstrup, Denmark), WS (Warsaw, Poland), WG (Wageningen, the Netherlands), RR (Rothamsted, UK), MA (Mannheim, Germany), DC (Debrecen, Hungary), CF (Clermont-Ferrand, France), MO (Montagnano, Italy) and SL (Seville, Spain) (see Table SI.1 for details). Box plots are constructed from 15 predictions of mean day of anthesis (and maturity) for climate scenarios (each consists of 300 yrs of daily weather) based on 15 individual GCMs from the CMIP ensemble. Box boundaries indicate the 25 and 75-percentiles, the line within the box marks the median, whiskers below and above the box indicate the 10 and 90-percentiles.
