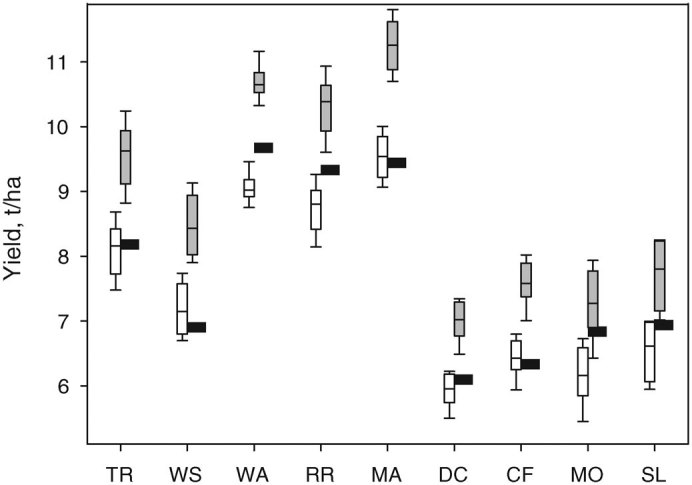
Figure 2. Grain yield.

Mean simulated grain yield for the baseline (black rectangles) and for the 2055(A1B) climate scenario with no change in [CO2] of 338 ppm (considering effect of change in climate only, open box plots) and increased [CO2] of 541 ppm (gray box plots) corresponding to the A1B emission scenario. All wheat cultivars were assumed to be tolerant to heat stress around anthesis.
