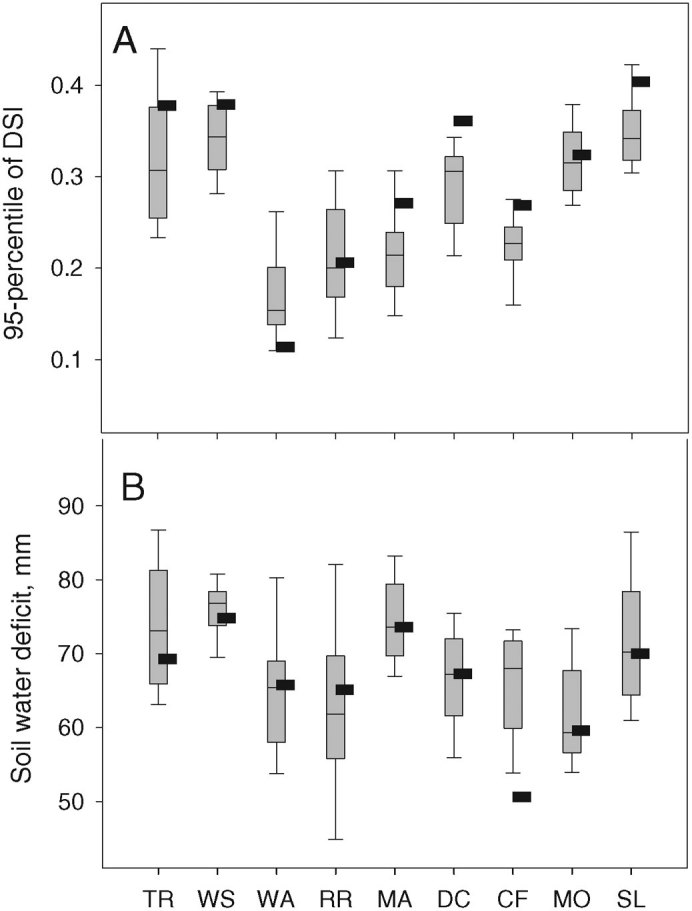
Figure 3. (A) 95-perccentiles of DSI, and (B) soil water deficit at anthesis.

For the baseline (black rectangles) and for the 2055(A1B) climate scenarios (box plots).

For the baseline (black rectangles) and for the 2055(A1B) climate scenarios (box plots).