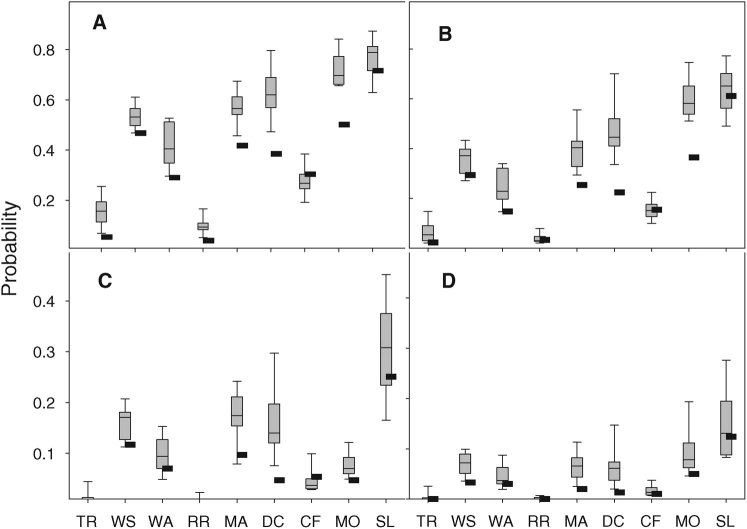
Figure 4. Probability of maximum temperature exceeding temperature thresholds.
Thresholds of 27°C (A,B) or 30°C (C,D) within 3 days of anthesis (A,C) or consecutively with 3 days of anthesis and within 3 days of five days after anthesis (B,D) for the baseline (black rectangles) and for the 2055(A1B) climate scenarios (box plots). Sirius was used to calculate anthesis dates for each individual year of baseline and 2055(A1B) climate scenarios for 15 GCMs from the CMIP3 ensemble.

