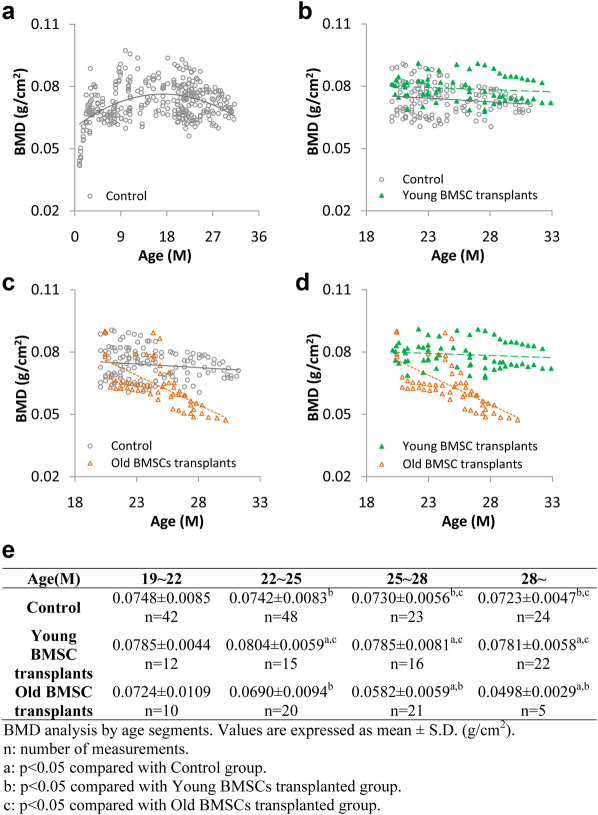
Figure 5. BMD measurements of Balb/c mice.
(A) The distribution of bone density in untreated mice from 1–33 months (open circles with polynomial treadline, order = 2, n = 99). (B) The distribution of BMD in mice transplanted with BMSCs isolated from young mice (green solid triangles with green dash linear trendline, n = 15) compared with untreated controls (gray open circles with linear trendline, n = 9). (C) The distribution of BMD in mice transplanted with BMSCs isolated from old mice (orange open triangles with orange dash linear trendline, n = 10) compared with untreated controls (gray open circles with linear trendline, n = 9). (D) Direct comparisons of BMD distribution between mice transplanted with young BMSCs (green solid triangles with green dash linear trendline, n = 15) and those with old BMSCs (orange open triangles with orange dash linear trendline, n = 10). (E) Comparison of the averages of BMD at different age ranges.

