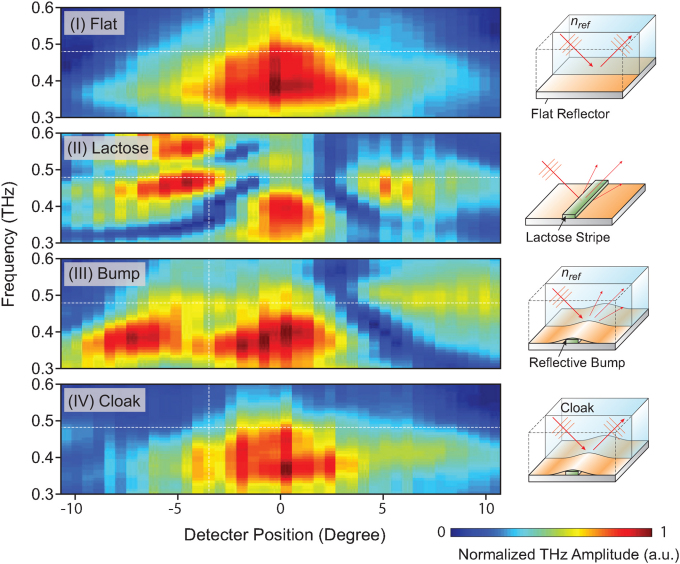
Figure 3. Spectra maps of four experimental cases.
(I) Reflective flat, (II) exposed α-lactose monohydrate, (III) reflective bump, and (IV) cloak, are measured using reflection terahertz time-domain spectroscopy. The lactose (II) shows both a scattering effect and absorption. The reflective bump (III) avoids the absorption effect, but is still split into three peaks. The measured spot position of the cloak (IV) and the reflective flat (I) match reasonably well with each other.

