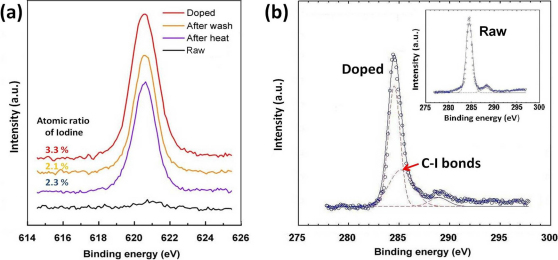
Figure 2. XPS spectra of the I-doped cable.
(a) Iodine spectra at different treatments. The black and red lines are the spectra for the cable before and after the iodine doping, respectively. The yellow line is collected from the doped cable after it was washed by ethanol. The blue line is collected from the doped cable after it was heated in the vacuum oven at 150°C for 72hrs. Inset of (b) and (b) are the XPS spectra for the cable before and after the iodine doping. The spectra curves (blue circles) are de-convoluted (dashed lines) by Gaussian fitting (solid lines), indicating multiple bonding energies.

