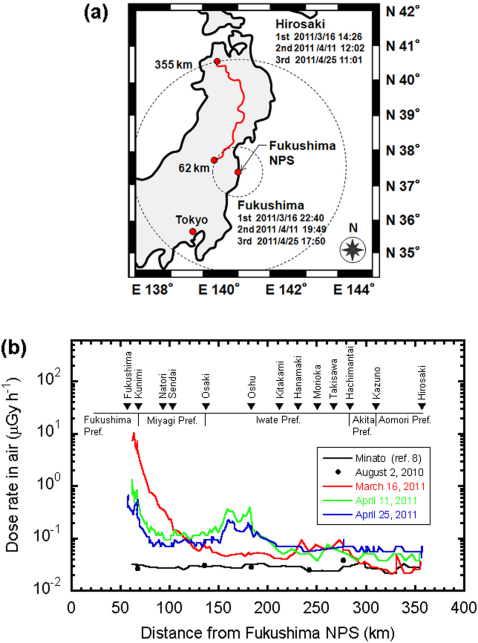
Figure 1. (a) Expressway survey route for measuring dose rates in air from Hirosaki City to Fukushima City.
The starting point on March 16 and April 11 was Hirosaki City and on April 25 it was Fukushima City. Total distance on the expressway was 1256 km. (b) Temporal variation of dose rates in air before and after the start of the Fukushima NPS crisis. The black line shows the dose rate in air reported by Minato8 in 2006. The solid black symbols are dose rates in air measured on August 2, 2010. The red, green and blue lines are dose rates in air measured on March 16, April 11 and April 25, 2011, respectively.

