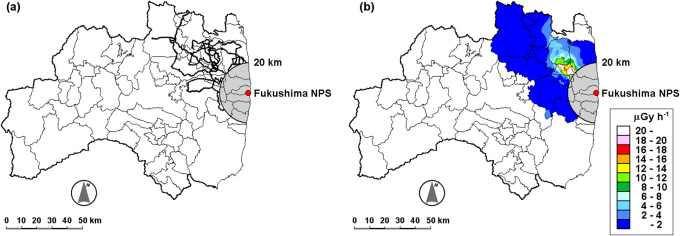
Figure 3. (a) Survey route for measuring dose rates in air within the high level contamination area.
Total distance for the car-borne survey in this area was 730 km. (b) Distribution map of the dose rates in air within the high level contamination area in Fukushima Prefecture. The rates were classified into eleven groups from <2 μGy h−1 to >20 μGy h−1 at intervals of 2 μGy h−1.

