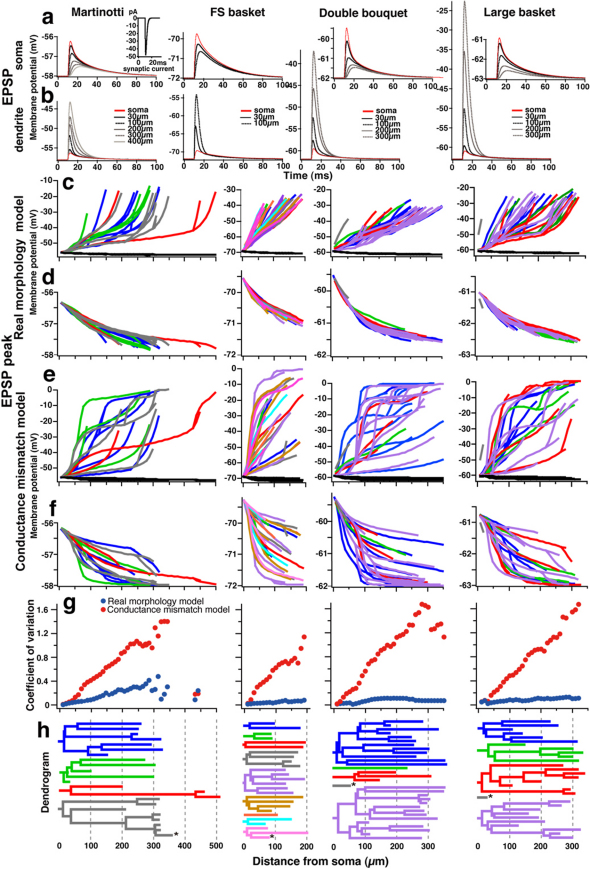
Figure 6. Functional significance of branch point geometry.
(a–f) Attenuation of synaptic responses in dendrites. (a, b) Somatic (a) and local (b) responses to synaptic currents generated in different parts of the dendritic trees in “real morphology” model cells. Inset shows the injected alpha function synapse current (2 nS). (c) Plots of peak of somatic (black) and local synaptic depolarization (color-coded as dendrogram shown in h) in response to synaptic input to various parts of the dendrite of the real morphology model cells. (d) Peak somatic depolarization as shown in (c) but at a larger scale. (e) Plots of peak depolarization at the soma (black) and at the site of synaptic input (color-coded as in h) for synapses occurring in the dendrites of the “conductance-mismatch” models. (f) Peak somatic depolarization as shown in (e) but at a larger scale. Deviations among different branches are larger than the real model cells (d). (g) Plots of the coefficients of variation (CV) of peak somatic depolarization in response to synaptic input to dendritic compartments at a given distance from the soma for the models exhibited in (d) and (f). CVs in the real morphology model cell (blue circles) are very low across the entire dendritic length, while CVs in the conductance mismatch model cell (red circles) increase with distance from soma. (h) Color-coded dendrogram of the model cells used in simulations.

