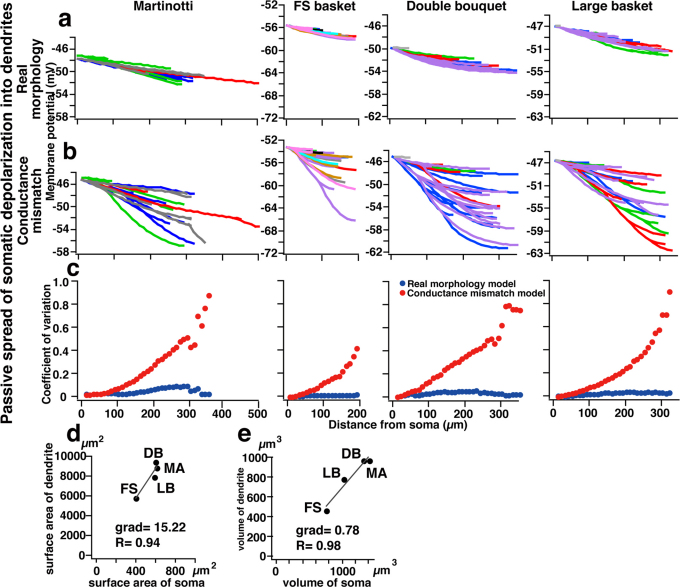
Figure 7. Dendritic branch points are optimized for uniform distribution of somatic voltage into the dendritic trees.
(a), Plot of peak depolarization of dendritic compartments in response to a 40 pA somatic steady current pulse injection into the “real morphology” model cells. Dendritic depolarization is fairly evenly distributed in dendritic branches. Primary dendrites, and their associated trees, are color-coded as in Fig. 6h. (b) Plot of peak depolarization of dendritic compartments in response to a 40 pA somatic steady current pulse injected into the soma of neurons having realistic morphologies. Color-coding as in Fig. 6h. (c), Plot of the coefficient of variation (CV) of peak depolarization for all dendritic compartments of a given distance from the soma (vs. distance from the soma) for the models shown in (a) and (b). CV of dendritic depolarization for the real morphology model cell (blue circle) is very low for entire dendritic length, On the other hand, the CV of dendritic depolarization in the conductance mismatch model cell (red circle) increases with distance from soma. (d) Surface areas of dendrites plotted against the surface areas of the soma as measured in the real morphology model cells. (e) The volumes of dendrites are plotted against the volumes of somata as measured in the real morphology model cells

