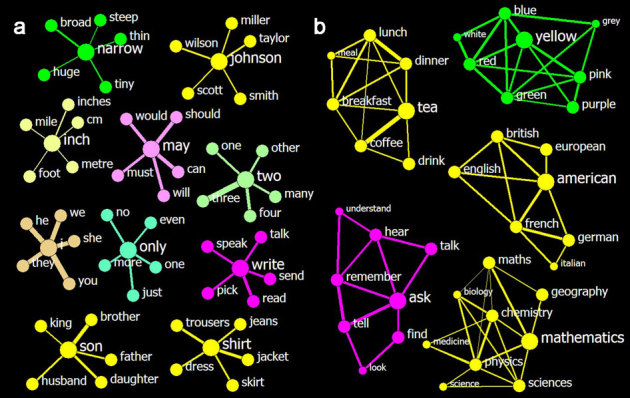
Figure 2. Top 5 neighbours of words and clusters identified by such types of neighbourhoods.

The colours are used to label parts of speech, the thickness of a link represents the strength of the affinity between its nodes, but the length means nothing. (a) Ten sample neighbourhoods show that the affinities are reasonably measured across different parts of speech. The central nodes in each neighbourhood are enlarged to promote ease of reading. The affinities range from 0.06 (inch∼mile) to 0.29 (two∼three). (b) Five sample clusters that were identified based on the top-5-neighbourhood show the effectiveness of the clustering. The nodes for the initial words are in the largest size, their neighbours have a medium size, and the neighbours' neighbours are the smallest. The affinities range from 0.05 (math∼chemistry) to 0.23 (tea∼coffee).
