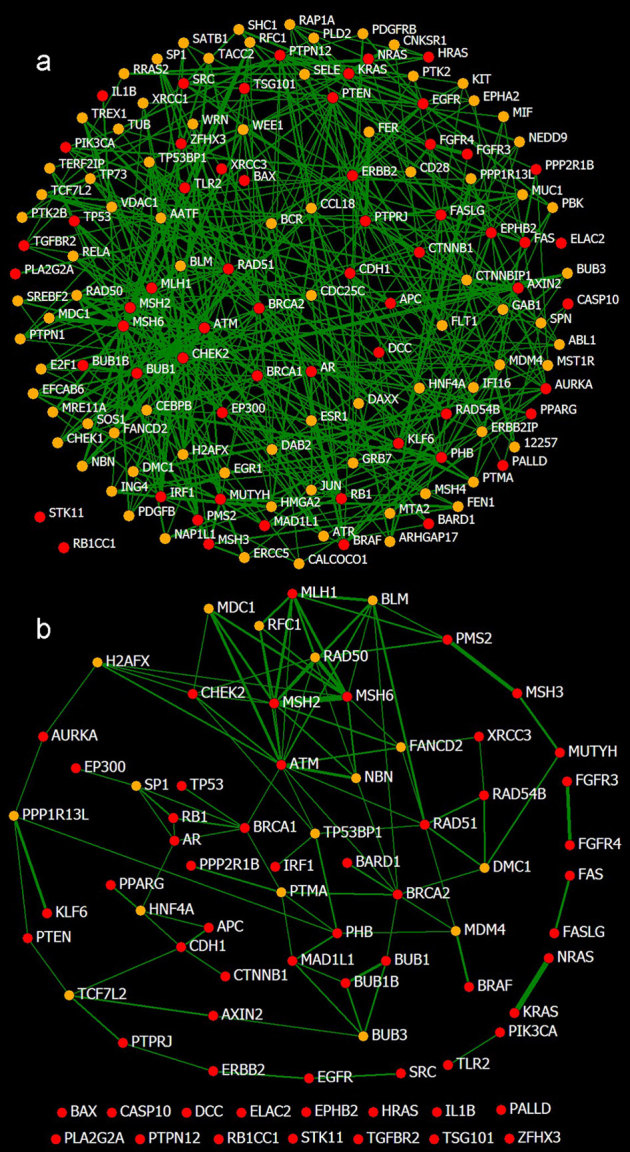
Figure 4. The affinity networks of cancer-associated proteins.

The nodes of CAPs (red) and CAPCs (orange) are linked to each other by their affinities that are higher than Ta. The thickness of a link represents the affinity. (a) Eighty-two CAPCs are identified by setting Ta = 0.03 (p < 10−2) and Tp = 4. Incorporating the 82 CAPCs, 58 CAPs form an integral network with 445 links that are stronger than Ta (not including the links between CAPCs), leaving only 2 isolated CAPs. A link-dense portion is located at the bottom left and covers the CAPs of RAD51, MLH1, MSH2, MSH6, BRCA2, ATM, CHEK2, BUB1 and BRAC1. The affinities range from 0.03 (AR∼PTPN1) to 0.31 (MSH6∼MSH2). (b) The core network of the affinities among the CAPs is revealed by enhancing Ta to 0.04 (p < 10−3), which includes 37 CAPs and 16 CAPCs. Eight CAPs are paired and 15 are isolated. The central portion that consists of ATM, MSH2, MSH6, CHEK2 and BRCA1 is crucial, which is consistent with the results of previous studies31,32,33,34,35. The 16 CAPCs may be particularly meaningful for cancer study. The affinities range from 0.04 (MSH6∼CDX2) to 0.31 (MSH6∼MSH2).
