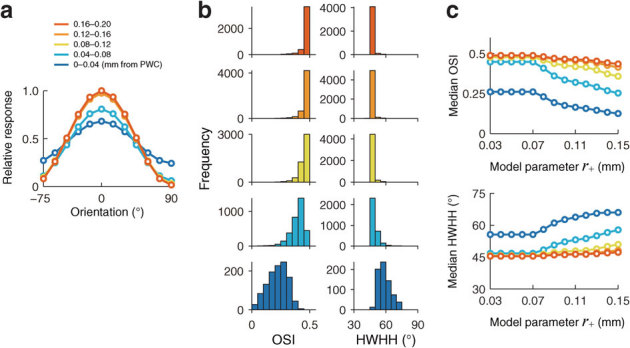
Figure 3. Predicted orientation tuning as a function of distance to PWCs.

The colors of the curves represent the map location as a function of distance from the nearest PWC. (a) Typical results of orientation tuning curves. Responses to an oriented stimulus within a neuron's classical receptive field (CRF) were calculated according to results in Fig. 2c, using a model cortex with monosynaptic connections defined by a Mexican hat-shaped function (see Methods and Supplementary Fig. S2a). The relative response amplitudes were obtained by dividing by the maximum response amplitude of neurons in regions 0.16–0.20 mm away from the PWC. The spatial extent of the connections was adjusted by a parameter representing the radius of the border between excitatory connections and inhibitory connections (r+). Here, r+ is set to 0.08 mm. (b) Distribution of orientation selectivity indices (OSIs) (panels in left column) and half-width of tuning at half-height (HWHH) (panels in right column) for 5 ranges of distances from PWCs. The color conventions are the same as those in (a). Both OSI and HWHH are measures of orientation tuning strength. For each neuron at the center of an ROI, these metrics were calculated from responses to stimuli within its CRF. The response to an oriented stimulus was computed using individual orientation populations, such as at the top right on Fig. 2b. The histograms of OSIs and HWHHs, grouped by distance from the PWC. (c) The variations in the median OSI (upper panel) and the median HWHH (lower panel) as a function of size parameter r+. The colors of curves correspond to those in (a).
