
Figure 3. Relationships between the air temperature anomaly and the soil GHG flux anomaly.
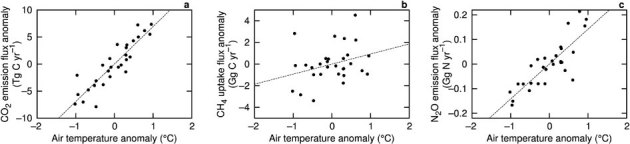
(a) for the CO2 emission flux (slope = 6.9 Tg C yr−1 °C−1, P<0.0001); (b) for the CH4 uptake flux (slope = 0.93 Gg C yr−1 °C−1, P = 0.0975); (c) for the N2O emission flux (0.14 Gg N yr−1 °C−1, P<0.0001). The effect of the atmospheric CH4 concentration on CH4 uptake was removed in this analysis. The anomaly from the average between 1980 and 2009 is shown.