
Figure 4. Impaired glucose-stimulated insulin secretion (GSIS) in chemerin-deficient pancreas, islets and MIN6 cells.
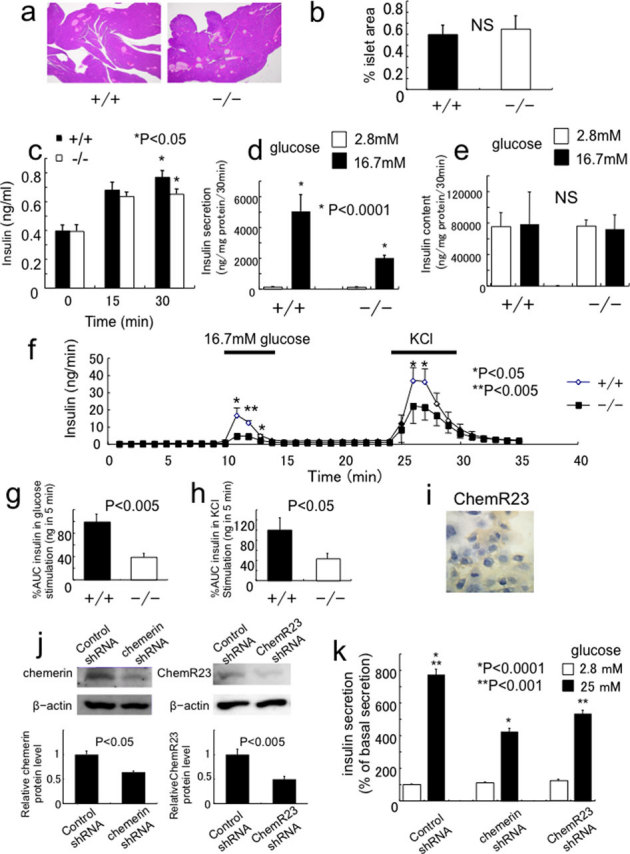
(a) Histological analysis of pancreas by H&E staining in chemerin (+/+) and (−/−) mice. Representative images are shown. (b) Percent islet area in 15-week-old (+/+) and (−/−) mice. (n = 4/genotype). (c) Serum insulin levels after glucose administration in 14-week-old mice. (n = 6/genotype). (d) Insulin secretion in islets isolated from at 12-14 week-old (+/+) and (−/−) mice. (n = 6 /genotype). (e) Insulin content in islets isolated from (+/+) and (−/−) mice. (f) In situ pancreatic perfusion in chemerin (−/−) mice. Insulin release was measured from perfused pancreata of (+/+) and (−/−) mice after the indicated stimuli. (n = 5–6/genotype). (g) The amount of insulin released (area under the curve [AUC]) after stimulation with 16.7 mM glucose. The AUC was significantly decreased in chemerin (−/−) pancreas. (h) The AUC was significantly decreased in chemerin (−/−) pancreas after KCl stimulation. (i) Immunohistochemical analysis of ChemR23 in MIN6 cells. (j) Knockdown of chemerin or ChemR23 in MIN6 cells. (k) GSIS was significantly reduced in chemerin- and ChemR23-knockdown MIN6 cells.