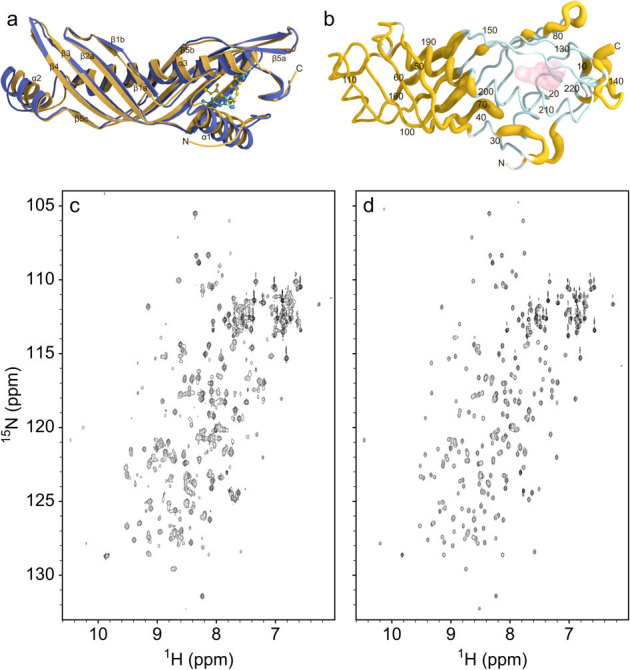
Figure 4. JH-induced silencing of conformational dynamics of JHBP in solution and ethanol-induced release of the bound-JH from the complex.

(a) The NMR solution structure of B. mori JHBP-JH III complex (yellow) is overlaid with the crystal structure of the JHBP-JH II complex (blue). The bound JH molecules are shown as ball-and-stick models. (b) Sausage model of the NMR solution structure of the JH III-bound JHBP where the diameter is proportional to the weighted chemical shift difference between the apo- and JH III-bound proteins in solution, calculated with the function Δδ = [ΔδHN22 + (Δδ15N/5)2]1/2. Shown in light-blue are residues for which NMR signals were not observed for the apoprotein due to chemical exchange between multiple conformational states on a time-scale of NMR chemical shifts. Proline and N-terminal residues are shown in white. The JH III molecule is shown as transparent surface. (c)1H-15N HSQC spectrum of the JHBP-JH III complex (200 μM) in 50 mM sodium phosphate buffer, pH 6 after the treatment with 30% ethanol, collected at 35°C on a Bruker DMX 750 spectrometer. The sample was prepared as follows. The JHBP-JH III complex was diluted to 10 μM in 50 mM sodium phosphate buffer, pH 6, in the presence of 30% ethanol at 4°C for one hour. The JH III molecules released from the complex were removed by solvent exchange with the same solvent using Amicon Ultra-15 centrifuge concentrator with 5 kDa cutoff, to avoid the rebinding of the unbound JH III to the protein. The residual ethanol was removed by exhaustive solvent exchange into the buffer used for the NMR measurement. The resultant protein sample provided the HSQC spectrum which displays two sets of signals, one set from the ligand-free JHBP and the other from the JHBP-JH III complex. The same treatment of the JHBP-JH III complex with 10% ethanol did not cause the unbinding of JH III from the complex, as evidenced by no spectral changes from the original JHBP-JH III complex (d).
