
Figure 3. Metabolite and pathway enrichment of targeted metabolomics and microarray.
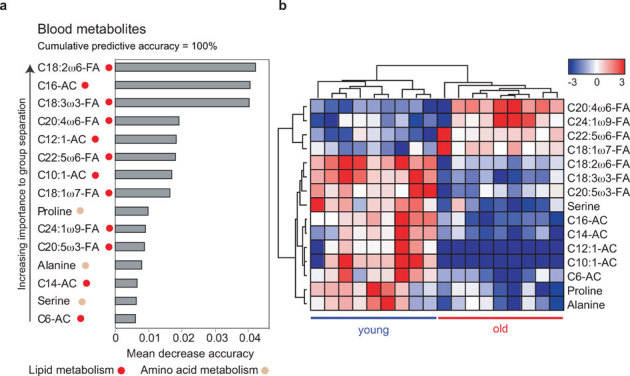
(A) To relate aging status to the blood metabolite expression data, we used random forest predictors. A random forest importance measure was used to rank metabolites according to their prognostic importance for aging status. We find that the 10 most important metabolites lead to an apparent predictive accuracy of 100%. (B) Supervised hierarchical clustering plot for visualizing the expression of the RF predictors (z-score normalized). The RF plot and the supervised hierarchical clustering plot show that the 15 most important metabolites stratify the samples according to their aging status. Metabolites described by FA are erythrocyte fatty acids, whereas ACs denote plasma acylcarnitines. A color code describes the pathway to which the respective metabolite belongs.