
Figure 4. Aging biomarker identification and pathway analysis by global metabolomics in liver.
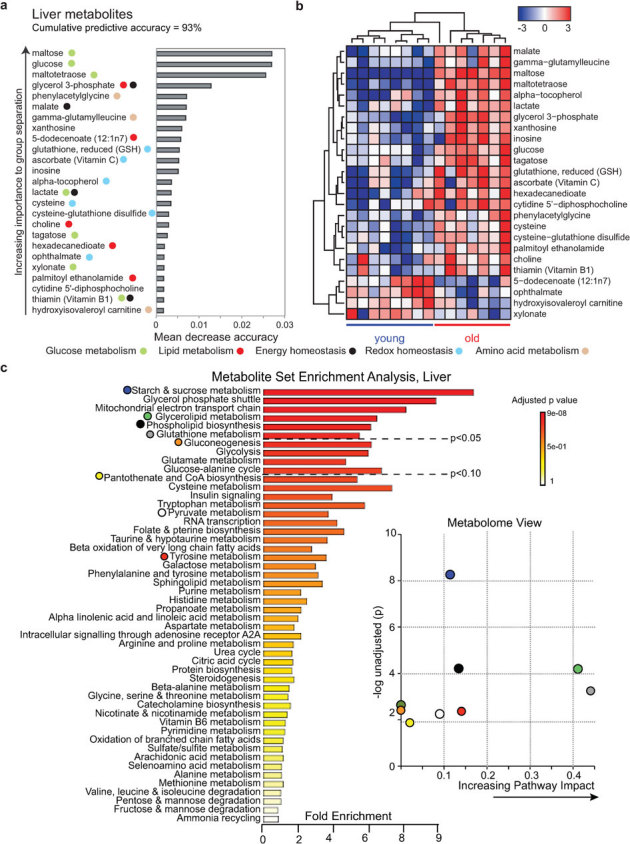
To relate aging status to the liver metabolite expression data, we used random forest predictors (A). Metabolites were ranked according to their increasing importance to group separation according to age. We find that the 25 and most important probesets lead to an apparent predictive accuracy of 93%. Colored symbols are used to indicate the pathways in which the metabolites play a role. Supervised hierarchical clustering plot (B) for visualizing the expression of the RF predictors (z-score normalized). The RF plot and the supervised hierarchical clustering plot show that the 25 most important metabolites stratify the samples according to their aging status. (C) Summary plot for metabolite set enrichment analysis (MSEA) (left panel) where metabolite sets are ranked according to Holm p-value with hatched lines showing the cut off of Holm p-value. Metabolome view (right panel) reflects on the x-axis increasing metabolic pathway impact according to the betweenness centrality measure, which reflects key nodes in metabolic pathways that have been significantly altered with aging.