
Figure 4. Simulation of initial TRAIL signaling model.
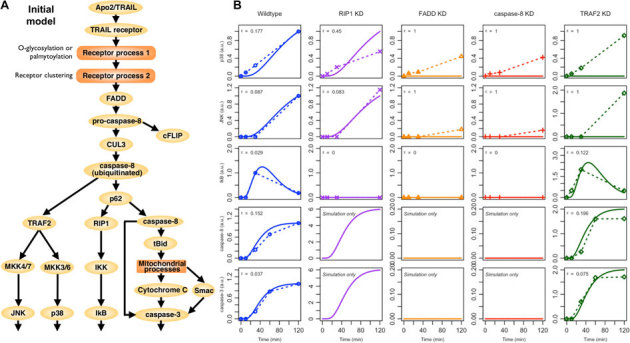
(A) Static topology of the TRAIL signaling pathway used in developing our
computational model. Note that we lump the similar effects of DR4/5 as
TRAILR1/2, and ignore the response of DcR1/R2/OPG. Also, note that we
include molecular conditions such as receptor clustering as additional
first-order terms. (B) Comparison of simulations (solid lines) with
experimental data (dotted lines) in wildtype, RIP1 KD, FADD KD, caspase-8
KD* and TRAF2 KD in arbitrary units (a.u.). The error  between simulations and
experimental data for the ith molecule in the
kth condition is calculated based on the area
between experimental and simulation curves (see Eq. 5 in Methods).
*caspase-8 KD also refers to pro-caspase-8 KD.
between simulations and
experimental data for the ith molecule in the
kth condition is calculated based on the area
between experimental and simulation curves (see Eq. 5 in Methods).
*caspase-8 KD also refers to pro-caspase-8 KD.