
Figure 6. Simulations of the proposed TRAIL signaling topology.
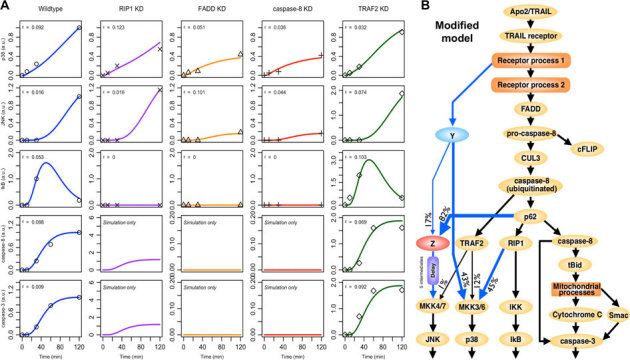
(A) Comparison of M5 simulations (solid lines) with experimental data (black points) in wildtype, RIP1 KD, FADD KD, caspase-8 KD and TRAF2 KD. (B) Static topology of the proposed model for TRAIL signaling pathway. Modifications are indicated by blue arrows.