
Figure 7. Identifying key target for sensitizing TRAIL resistance.
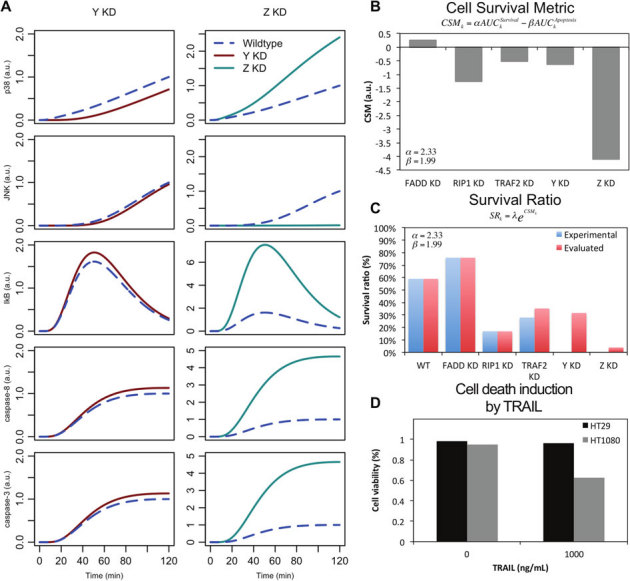
(A) Simulation profiles of p38, JNK, IκB, caspase-8 and -3 in Y and Z KDs. (B) Cell survival metric (CSM) for all KDs. (C) Survival ratio, SR, (experimental versus evaluated, from t = 0 to 120 min) in all conditions. Evaluated data is obtained using experimental data of RIP1 and FADD KDs (see Methods). (D) Wildtype HT1080 and HT29 (control) cells shows 60% and 95% survival, respectively, for 1000 ng/mL of TRAIL stimulation.