
Figure 3. Analysis of FN organization of cells unstimulated and exposed to mechanical stimulation.
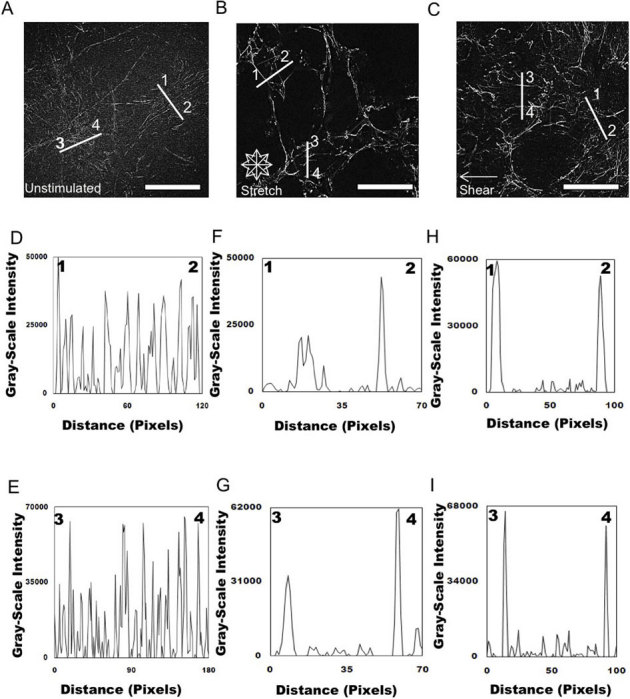
Epifluorescent images were imported into ImageJ software and deconvolved to analyze the distribution of unstimulated (A) and mechanically stimulated (equibiaxial stretch (B) shear fluid flow (C) FN across the cell. Representative plots of intensity profiles plotted as a function of distance (measured in pixels) versus intensity (measured in gray-scale values) showed FN distribution for unstimulated cells (D) line 1–2 and (E) line 3–4. The multiple fluorescence intensity peaks in a diversity of areas revealed that FN did not seem to be localized in specific areas within the cell. Plots of intensity profiles of FN distribution after 24 hours of 10% equibiaxial stretch (F) line 1–2 and (G) line 3–4 revealed FN redistributed around the cell periphery, which was reflected in the distinct fluorescence intensity peaks located at the ends of the lines, indicating the periphery of the cell. Analysis of FN distribution after 24 hours of 6±3 dynes/cm2 of fluid flow shear stress, (H) line 1–2 and (I) line 3–4 revealed that the FN was distributed around the cell periphery, which was reflected in the distinct fluorescence intensity peaks located at the ends of the lines indicating the periphery of the cell. (scale bar = 10 μm). On average 100 cells (20 – 30 lines/cell) were analyzed for all of the conditions; these are representative responses.