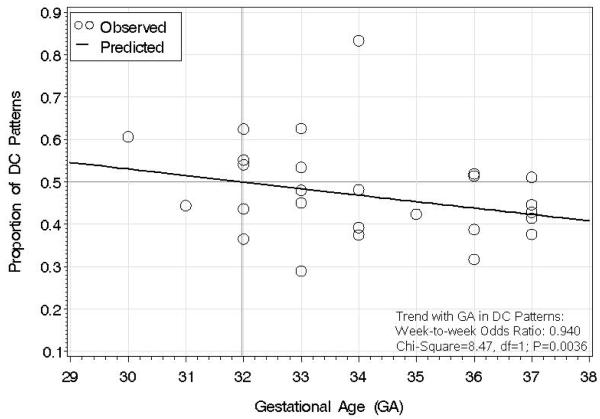
Figure 3.
Proportion of discontinuous (DC) patterns across gestational age (GA) in weeks. Logistic regression was used to generate the trend line of predicted proportions. The trend line shows that, at each week, there is a 6% decrease in Odds of a DC pattern compared to the previous week (week-to-week Odds Ratio: 0.940; P=0.0036).

