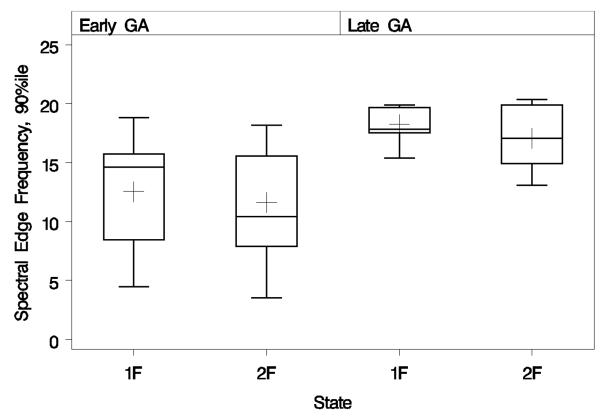
Figure 4.
Box-and-whiskers plots of spectral edge frequencies calculated on fetal recordings, grouped by gestational age (GA) and fetal state. Boxes extend vertically from the distributions’ 25th to 75th percentiles, while lower and upper whiskers extend to their minima and maxima, respectively. Inside each box, the horizontal line denotes the median while the plus sign denotes the mean. On average, spectral edge frequencies increase significantly from early to late GA.

