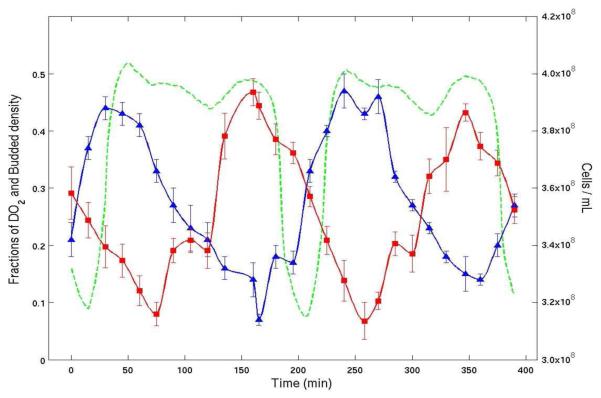
Figure 2.
Experimental time series from a continuous culture of budding yeast. Dissolved O2 percentage (green), bud index percentage (blue) and cell density (red) are plotted versus elapsed time. The average cell cycle period as calculated from dilution rate was about 400 minutes. The plot shows clearly that the bud index (percentage of cells with buds from microscopy) and cell density (by flow cytometry) are both synchronized with the oscillation in the level of dissolved O2.

