
Figure 3.
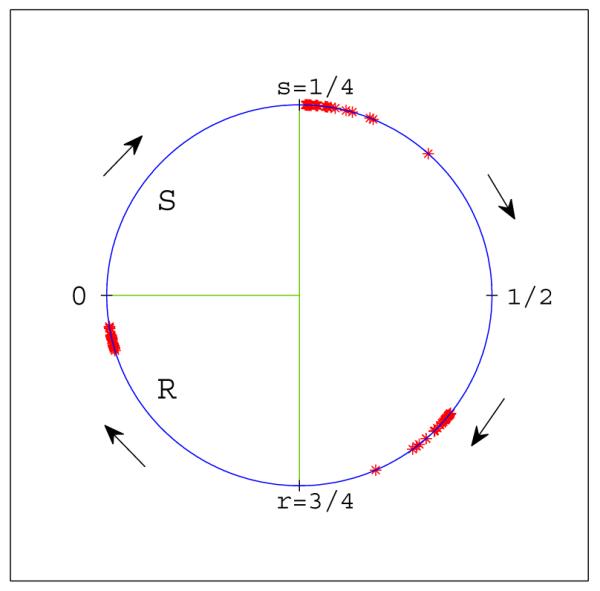
Our coordinate representation of the cell cycle and (weakly clustered) groups of cells from a negative feedback simulation with n = 200 and parameter values s = .25 and r = .75. Positions of individual cells are denoted by red asterisks. In this coordinate system the S region is the interval [0, .25) and the R region is [.75, 1), where 1 is identified with 0.