
Figure 9.
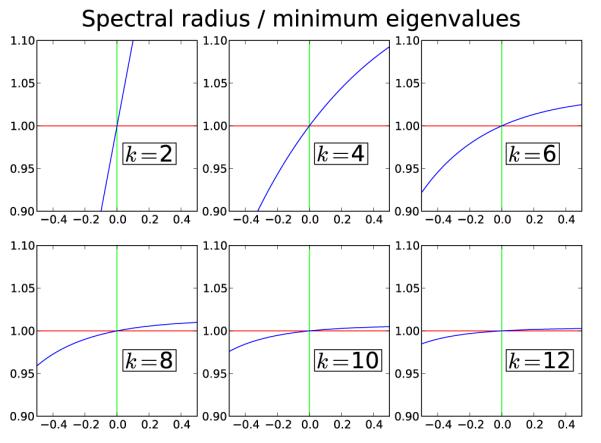
Case 1. The spectral radius / smallest eigenvalue modulus for k = 2, 4, …, 12. The x-axis is the feedback parameter β. For negative β, the y-axis is the spectral radius of A. For positive β, the smallest eigenvalue (w.r.t. modulus) is plotted. The plots show that the k = M + 1 solution is stable for negative feedback and unstable (in all directions) for positive feedback. Notice that as k grows, the stability/instability becomes weaker.