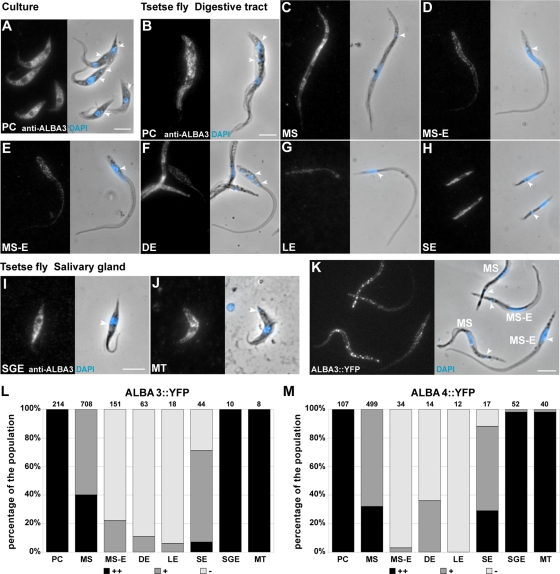
FIGURE 4:
ALBA3/4 expression level during parasite development in the tsetse fly. (A–J) Evolution of ALBA3/4 expression level assessed by IFA with the anti-ALBA3 antibody (left) and counterstained with DAPI (blue in the phase contrast image). ALBA signal in (A) Lister 427 procyclic cells in culture, (B–H) AnTat1.1 parasites derived from the digestive tract, and (I, J) salivary glands of the tsetse fly (normalized fluorescent signal). (K) Trypanosomes of the strain AnTat1.1 expressing endogenous ALBA3::YFP, derived from the tsetse proventriculus, fixed and stained with DAPI. Scale bars, 5 μm; arrowheads, the localization of the kinetoplast (A–K). (L, M) Percentage of strong (black), positive fluorescent (dark gray), and negative cells (light gray) at the different stages of the parasite cycle of AnTat1.1 parasites expressing endogenously tagged ALBA3::YFP (L) and ALBA4::YFP (M) obtained upon tsetse fly dissection. For ALBA3::YFP, data are the sum of two separate infection experiments (total 168 flies; 68 were dissected), whereas 93 flies (36 dissected) were used for ALBA4::YFP in one infection experiment. Analysis was performed on live cells as described in the text; the number of counted cells is indicated on top of the bars. Cells are shown in the order of appearance during the infection cycle in the tsetse fly: procyclic (PC), mesocyclic trypomastigote (MS), parasites in transition from mesocyclic trypomastigote to epimastigote (MS-E), and asymmetrically dividing epimastigote (DE) into a long (LE) and a short epimastigote (SE); in the salivary glands (I, J), salivary gland epimastigote (SGE) and metacyclic (MT).

